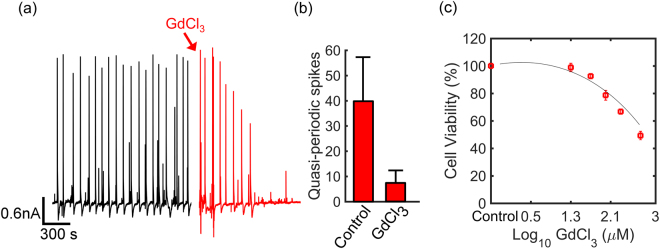
Figure 6.
Selective blocking of Ca2+ stretch-activated channels. (a) Diatoms were kept in dark for more than 2 day/night cycles. The black trace of the current recording depicts the current fluctuations at the start of the experiment. The red trace is obtained after adding the inhibitor GdCl3 to the culture medium up to a concentration of 100 μM. (b) Data quantification recorded over 3 experiments. Current spikes were counted 45 minutes before, called control, and after adding the inhibitor, called GdCl3. (c) Cell viability in percentage upon exposure for 24 hours to different concentrations of GdCl3; at 100 μM there is no impact on cell viability.

