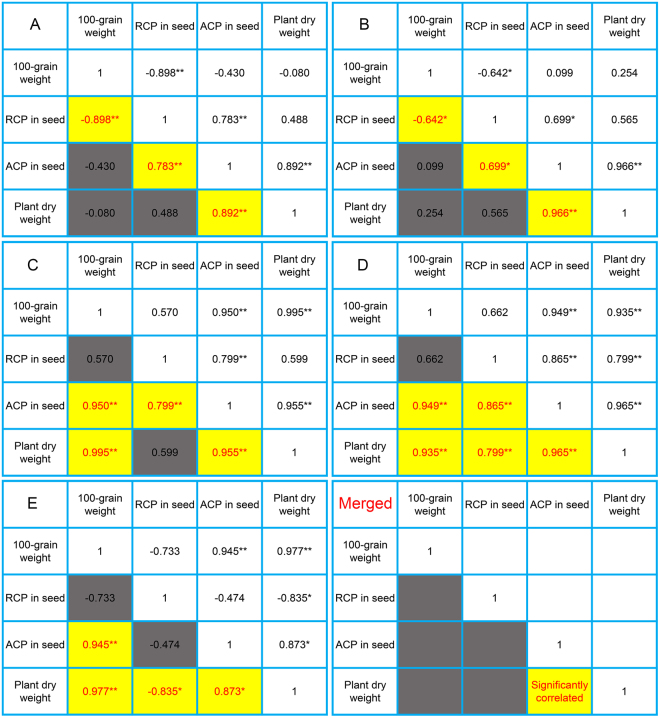
Figure 1.
Correlation analysis of seed traits and seedling traits in wheat. (A) Wheat seed produced under different nitrogen level. Four nitrogen level: N0 (0 kg/ha), N168 (168 kg/ha), N240 (240 kg/ha, the usual nitrogen fertilizer level for winter wheat production in the North China Plain) and N300 (300 kg/ha). (B) Wheat seed came from big spike of experiment A, and other treatments of experiment B was the same with experiment A. (C and D) Wheat seed came from different parts of spike (top 1/4, middle 1/3 and bottom 1/4) under N0 and N240 treatments, respectively. (E) Wheat seed produced under different irrigation after anthesis. Two water level: normal irrigation and no irrigation with control rainfall. RCP: the relative content of protein (%). ACP: the absolute content of protein (mg seed−1). Asterisks denote a significant correlation (*p < 0.05; **p < 0.01).

