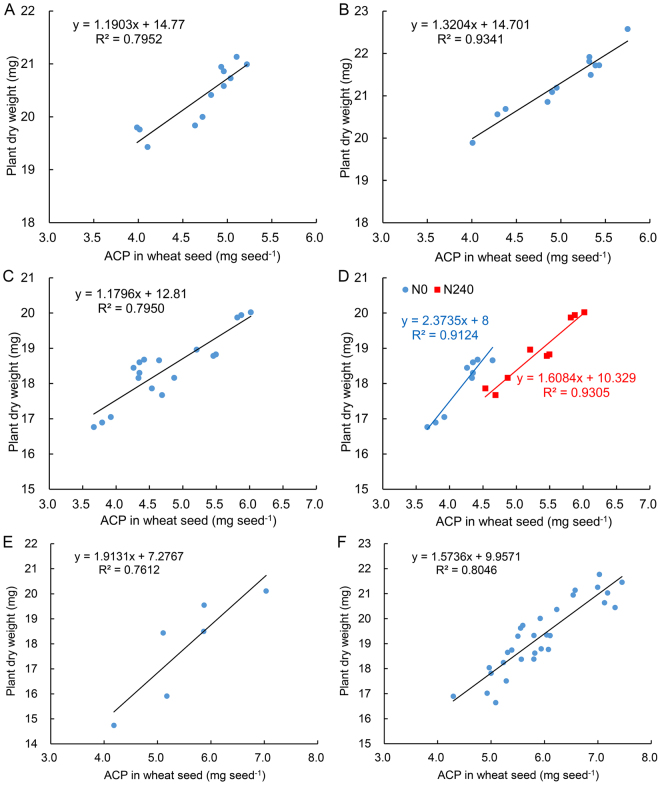
Figure 2.
Regression analysis of ACP in wheat seed and plant dry weight at seedling stage. (A) Wheat seed produced under different nitrogen level. Four nitrogen level: N0 (0 kg/ha), N168 (168 kg/ha), N240 (240 kg/ha, the usual nitrogen fertilizer level for winter wheat production in the North China Plain) and N300 (300 kg/ha). (B) Wheat seed came from big spike of experiment A. (C and D) Wheat seed came from different parts of spike (top 1/4, middle 1/3 and bottom 1/4) under N0 and N240 treatments, respectively. (E) Wheat seed produced under different irrigation after anthesis. Two water level: normal irrigation and no irrigation with control rainfall. (F) Thirty wheat seed lots included 27 wheat cultivars seeds produced in normal regional trial, two wheat cultivars seeds produced in drought condition and one wheat cultivars seeds produced in low nitrogen condition. ACP: the absolute content of protein (mg seed−1).

