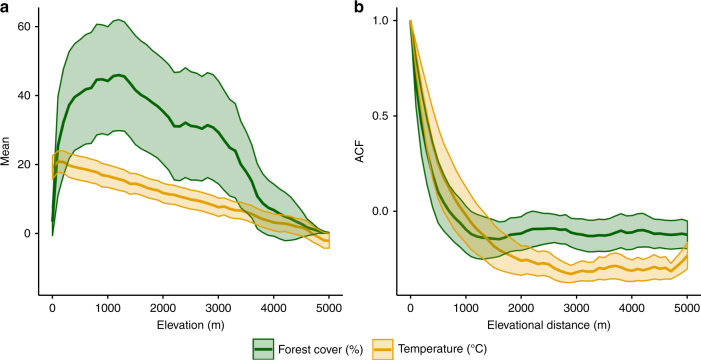
Fig. 1.
Spatial autocorrelation signal of forest cover and temperature across elevation. a General pattern of forest cover (%) and temperature (°C) per 100 m elevational band for 140 global mountain ranges. b The associated autocorrelation function (ACF) displaying the elevational autocorrelation signal of the proportion of forest cover and temperature along the elevational gradient. Lines and shade each represent the mean and ± 0.5 S.D. boundaries. For details on calculation refer to Supplementary Methods

