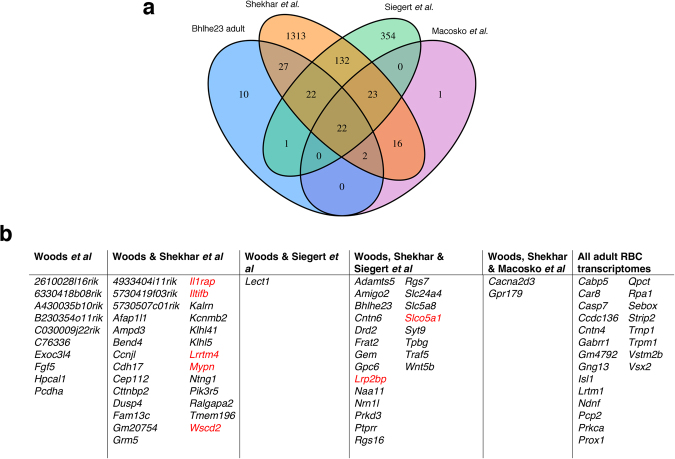
Figure 4.
Comparative analyses of the adult RBC transcriptome with published datasets. (a) Venn diagram showing the degree of overlap between the datasets derived from the adult Bhlhe23−/− retina (cited herein as Woods et al.) and other published transcriptomes16–18. The gene lists used to produce this plot and the degree in overlap are shown in Table S1. (b) Figure depicting the names of genes that overlapped between the datasets derived from the adult Bhlhe23−/− retina (Woods et al.) and other published transcriptomes16–18. Genes are listed in alphabetical order and not in order of fold change or padj values. Genes selected for further investigation by immunolabelling are in red.

