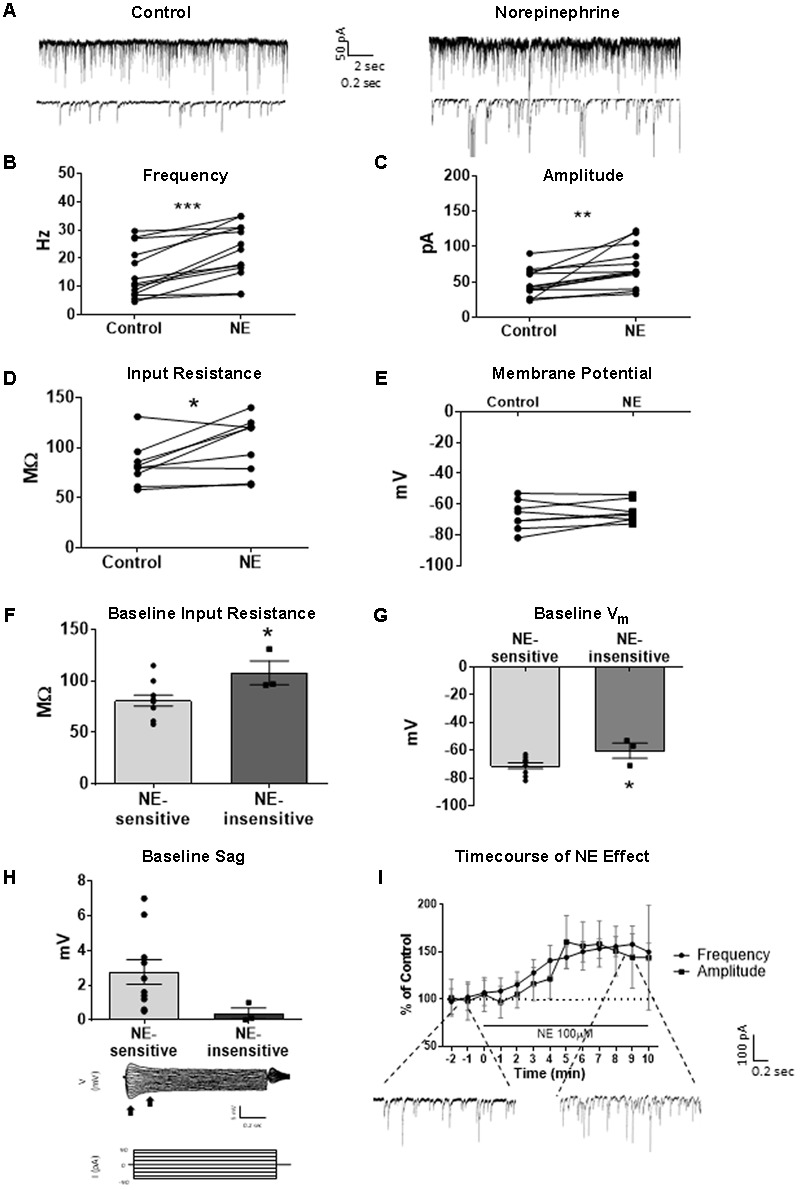
FIGURE 1.

Norepinephrine (100 μM) increases spike-dependent IPSC frequency, amplitude, and input resistance in a subset of principal neurons. (A) 20 s (top) and 2 s (bottom) of sIPSC voltage-clamp recordings with KCl intracellular solution representative of control (left) and NE (right) conditions (n = 13). (B) NE significantly increased average sIPSC frequency. (C) NE significantly increased sIPSC amplitude. (D) NE significantly increased average input resistance but had no effect on membrane potential (n = 9) (E). (F) Comparison of baseline input resistance in cells that show >15% increase in sIPSC frequency (n = 10) vs. cells that show no change (n = 3) in sIPSC frequency. (G) Comparison of baseline membrane potential in cells that show >15% increase in sIPSC frequency (n = 10) vs. cells that show no change (n = 3). Note that the NE-insensitive group has a significantly depolarized average baseline membrane potential in comparison to the NE-sensitive group. (H) Comparison of baseline sag amplitude in cells that show >15% increase in sIPSC frequency (n = 10) vs. cells that show no change (n = 3). Note that the NE-sensitive group has larger average baseline sag, though the difference is not significant potentially due to the low number of cells in the NE-insensitive group. Below: Example trace showing sag response (peak vs. steady-state indicated by black arrows) due to Ih activation following hyperpolarizing steps in voltage clamp. (I) Time course of the effect of NE on frequency and amplitude of sIPSCs in 1-min intervals. NE enters the bath at time 0. Insets show representative voltage clamp recordings with CsCl intracellular solution. Data values shown are the average of each group ± SEM control was compared to NE using paired t-test. NE sensitive and insensitive cells were compared using unpaired t-test (∗p < 0.05, ∗∗p < 0.01, ∗∗∗p < 0.001).
