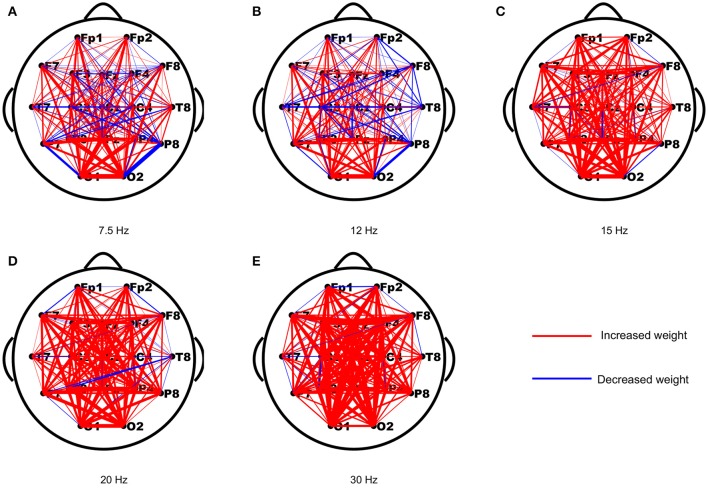
Figure 1.
The averaged changes in functional connection weights across subjects between the resting-state and stimulus-evoked networks for the five stimulus frequencies. (A) 7.5 Hz; (B) 12 Hz; (C) 15 Hz; (D) 20 Hz; (E) 30 Hz. The red lines indicate increased weights and the blue lines indicate decreased weights.

