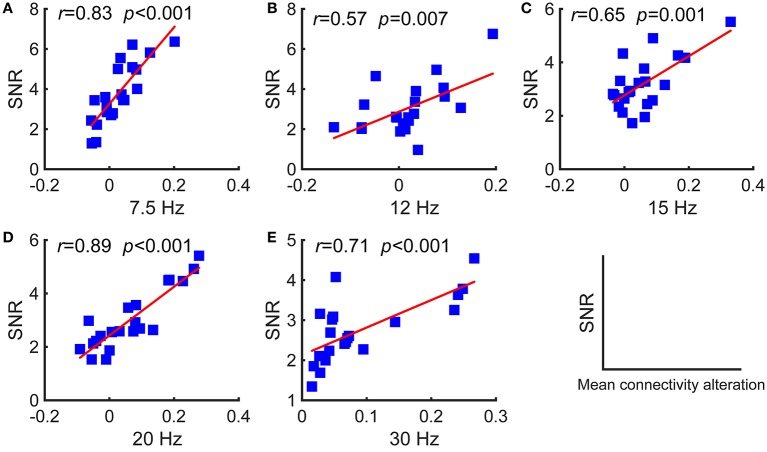
Figure 5.
Pearson's correlations between the SNRs and the differences in the mean functional connectivity of the two types of networks for the five stimulus frequencies. (A) 7.5 Hz; (B) 12 Hz; (C) 15 Hz; (D) 20 Hz; (E) 30 Hz. The red lines indicate the fitted linear trend. The r denotes correlation coefficients, and p denotes the significance level of the correlation coefficients.

