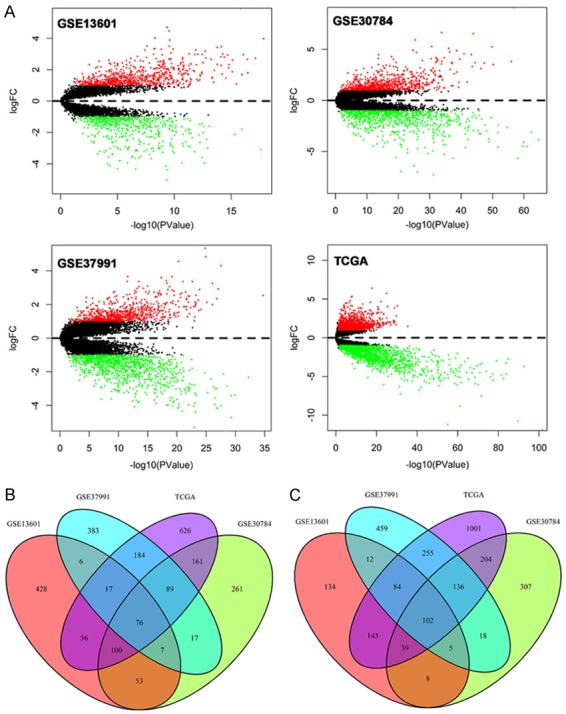
Figure 1.

Volcano plots of genes that are significantly different between OSCC tissues and normal controls. X-axis indicates the p values (log-scaled), whereas the Y-axis shows the fold change (logscaled). Each symbol represents a different gene, and the red/green color of the symbols categorize the upregulated/downregulated genes falling under different criteria (p value and fold change threshold). p value <0.05 is considered as statistically significant, whereas fold change = 2 is set as the threshold (A). The common differentially expressed genes among GSE13601, GSE30784, GSE37991 and TCGA (B, C).
