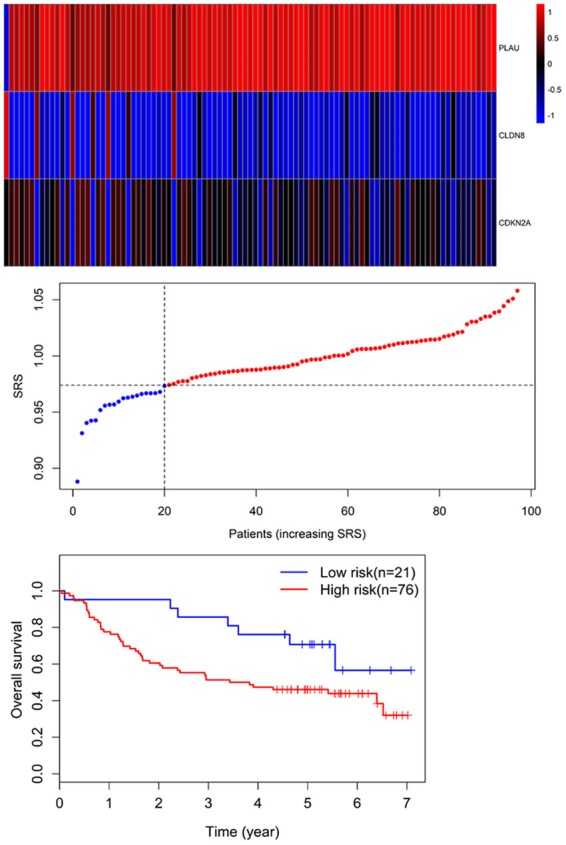
Figure 7.

Three-gene expression and risk score distribution in the GSE41613 cohort by z-score, with red indicating higher expression and light blue indicating lower expression. The risk scores for all patients in GSE41613 cohort are plotted in ascending order and marked as low risk (blue) or high risk (red), as divided by the threshold (vertical black line). The OS of the high-risk patients (46.1%; 95% CI = 36.1%-58.7%) was significantly lower in comparison with that of low-risk patients (70.7%; 95% CI, 53.5%-93.6%) (P = 0.039).
