
Figure 1.
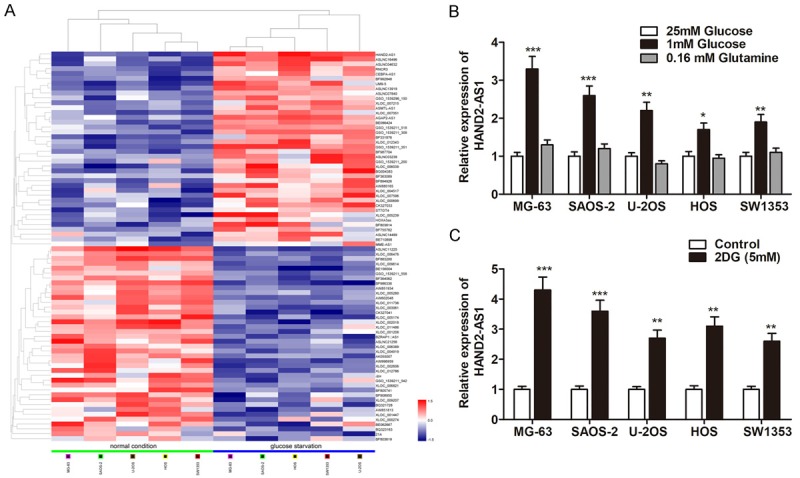
Energy stress induces lncRNA HAND2-AS1 in osteosarcoma cells. A. The heat map showed the top 50 most increased and decreased lncRNAs in osteosarcoma cell lines cultured under glucose starvation condition as compared to that cultured under normal condition by Hiseq. B. Bar graph shows the relative expression changes of HAND2-AS1 by qRT-PCR in osteosarcoma cells under different culture conditions for 48 h as indicated. C. The expression changes of HAND2-AS1 were determined in osteosarcoma cells treated with 2DG (5 mm) for 24 h.