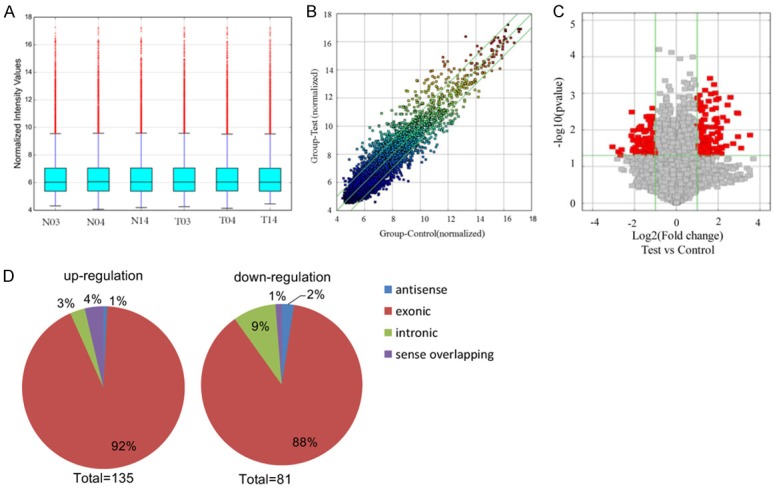
Figure 2.

Overview of the microarray signatures. A. The box plot is used to quickly visualize the distributions of a dataset for the circRNAs profiles. After normalization, the distributions of log2 ratios among 6 samples are nearly the same (T: tumor tissue; N: normal tissue). B. The scatter plot shows the circRNA expression variation between the cancer and normal samples. The axis represents the mean normalized circRNA signal values for each comparator group (log2 scaled). The green fold-change lines represent 2.0× fold-changes, so the circRNAs lying above and below these green lines displayed greater than a 2.0-fold upregulation or downregulation. C. Volcano plot of the differentially expressed circRNAs. The vertical lines correspond to 2-fold up and down, respectively, and the horizontal line represents P=0.05. The red point in the plot represents the differentially expressed circRNAs with statistical significance. D. Classification of dysregulated circRNAs. “Exonic” represents circRNA arising from the exons of the linear transcript; “Intronic” represents the circRNA arising from an intron of the linear transcript; “antisense” represents circRNA whose gene locus overlap with the linear RNA, but transcribed from the opposite strand; “sense overlapping” represents circRNA transcribed from same gene locus as the linear transcript.
