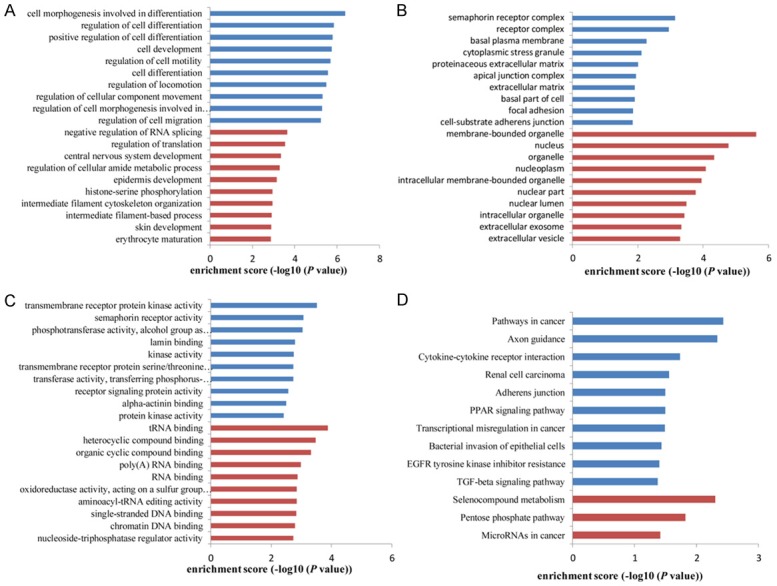
Figure 3.

GO enrichment and pathway analysis for dysregulated circRNAs gene symbols. Most significantly enriched GO (-log10 (P value)) terms of circRNAs gene symbols according to (A) biological process, (B) cellular component and (C) molecular function. (D) Top 10 classes of KEGG pathway enrichment terms (-log10 (P value)). Red bar represents upregulated circRNA gene symbol; blue bar represents downregulated circRNA gene symbol.
