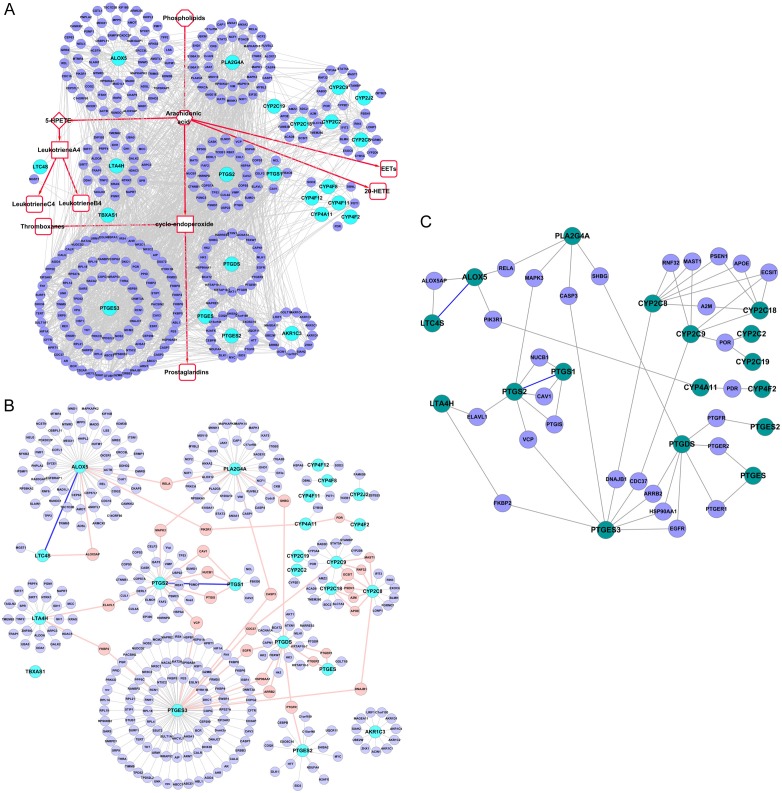
Figure 1.
Protein-protein interaction network (PPIN) of the canonical AA metabolism pathway. A. “Full-PPIN”, shows the interactions between known interactions in the network, as well as the non-enzymatic proteins. B. “Core-PPIN”, shows only key enzymes and their connecting proteins, reducing the redundant connections. C. “Compact-PPIN”, shows key AA metabolic enzymes linked through only one partner protein. Key AA metabolism enzymes are indicated in deep green, whereas the interacting proteins (non-enzymes and the linker) are shown in blue.

