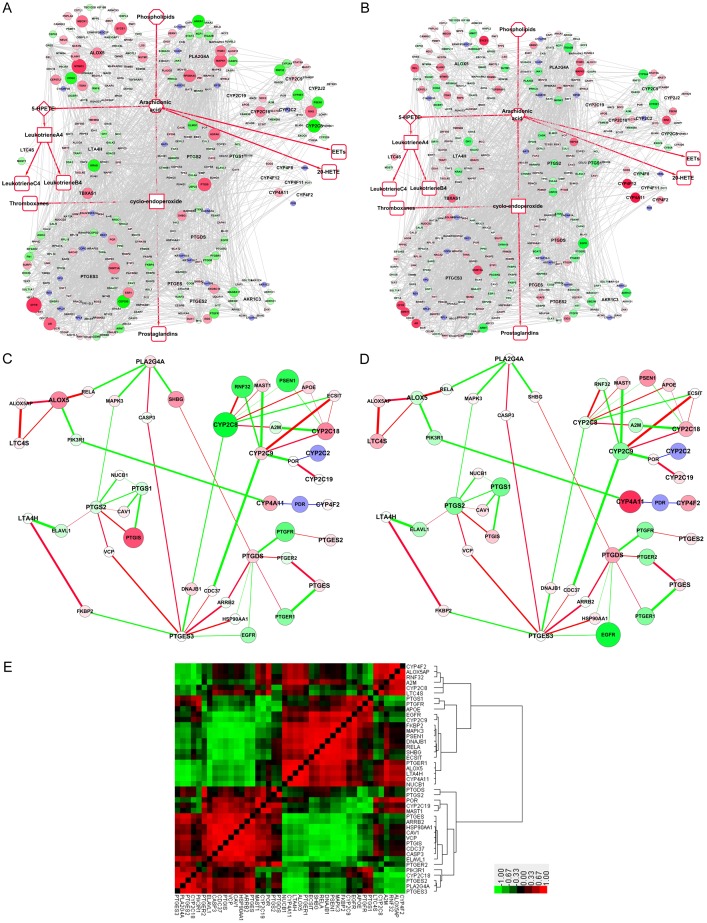
Figure 4.
Expression changes and correlations of AA metabolism PPIN genes, in the GSE9768 dataset, before and after treatment with acid. A. Fold change of AA metabolism in the Full-PPIN after 2 h treatment. B. Fold change of AA metabolism in the Full-PPIN after 6 h treatment. Green and red nodes represent proteins encoded by down- and up-regulated genes, respectively. Blue nodes represent interacting proteins that were not differentially expressed or were undetected in the microarray. C. Expression correlation between before and after the treatment with acid, using the fold-change following 2 h treatment as the background. D. Expression correlation of the compact-PPIN after treatment with acid, using the fold-change following 6 h treatment as the background. Red lines indicate positive correlations, while green lines suggest negative correlations. Lines are thicker when the correlation coefficients are higher. E. Heatmap of expression correlation after treatment with acid. Red blocks indicate positive correlations, while green blocks suggest negative correlations.

