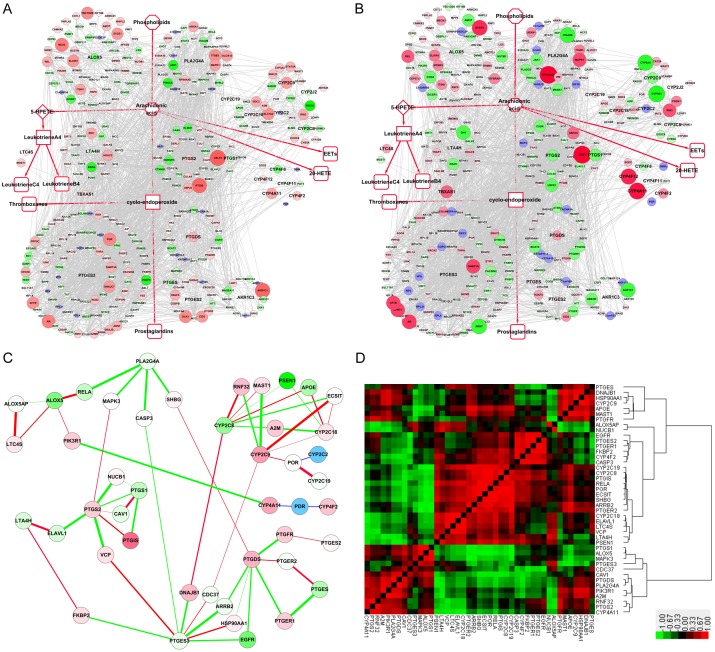
Figure 5.
Expression changes and correlations of the AA metabolism PPIN in the GSE9768 dataset after treatment with deoxycholic acid (DAC). A, B. Fold change of the AA metabolism “Full-PPIN” after DAC treatment for 2 h and 6 h, respectively. C. Expression correlation of genes, after treatment with acid, using the 2 h treatment as the background. D. Heatmap of expression correlation after treatment with DAC. Red block indicates positive correlations, whereas the green block suggests negative correlations.

