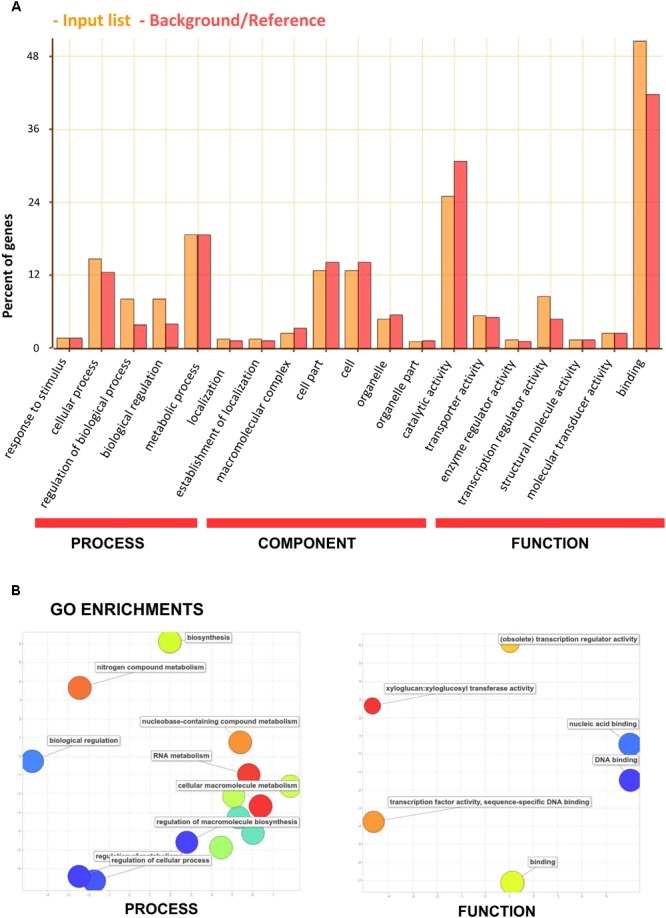
FIGURE 7.

Functional analysis (gene ontology) of the set of eggplant genes containing SSRs. (A) GO categorization. The orange bars indicate input genes, while the red bars indicate background genes. (B) REVIGO summary of “biological process” and “molecular function” enriched terms. The bubble size is proportional to the log10 (p-value) of enrichment analyses and its color is also a function of log10 (p-value) of enrichment analyses (blue: low, -red: high p-value). The x and y-axes reflect semantic similarity according to the REVIGO algorithm (similar GO terms appear close together).
