Fig. 2.

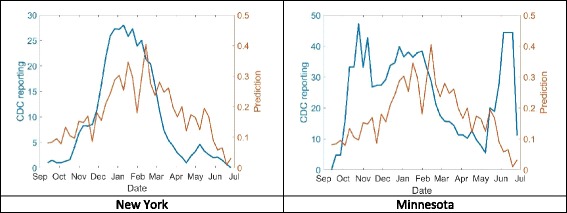
Actual versus predicted RSV incidence, based on a model of 50 Google Trends terms, for a state with high correlation (New York, 2a, left) and low correlation (Minnesota, 2b, right)

Actual versus predicted RSV incidence, based on a model of 50 Google Trends terms, for a state with high correlation (New York, 2a, left) and low correlation (Minnesota, 2b, right)