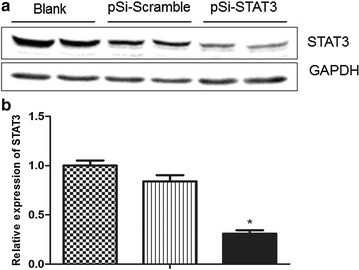
Fig. 1.

Verification of the knockdown efficiency of STAT3 in ECA109 cells. a Western blot analysis of STAT3 protein levels of ECA109 cells transfected with pSi-STAT3 or pSi-Scramble and untreated cells. GAPDH was used as a loading control. b Quantity of STAT3 protein levels compared to GAPDH. Data are represented as the mean ± SE, *P < 0.05, pSi-STAT3 group vs. pSi-Scramble group
