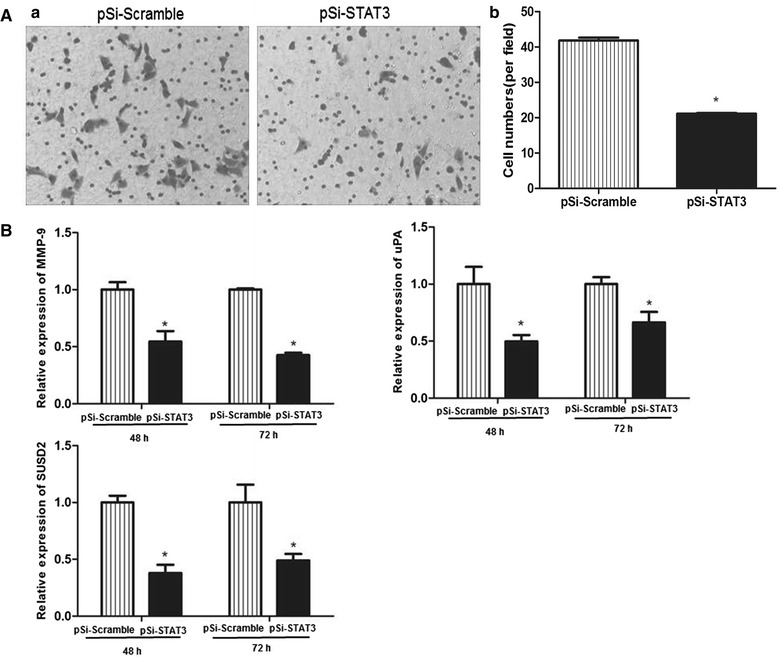
Fig. 6.

Effect of STAT3 down-regulation on cell migration in ECA109 cells. A Cell migration was determined by transwell assay after transfected for 72 h. The numbers of migration cells in five random microscopic fields (original magnification, ×200) were counted for each group. The results are an average of three independent experiments. B The mRNA relative abundance of MMP-9, uPA and SUSD2 were analysed by real-time PCR. Data shown represent the mean ± SE from three independent experiments.*P < 0.05, pSi-STAT3 group vs. pSi-Scramble
