Fig. 3.

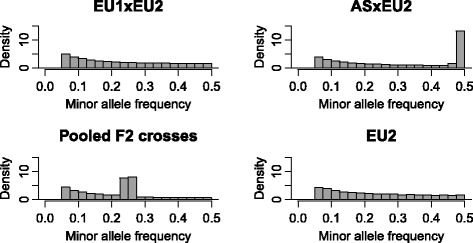
Minor allele frequencies for a randomly chosen trait. Minor allele frequencies for all SNPs with a MAF > 0.05 within the two F2 crosses (top line), their pooled data and the purebred experimental population (bottom line)

Minor allele frequencies for a randomly chosen trait. Minor allele frequencies for all SNPs with a MAF > 0.05 within the two F2 crosses (top line), their pooled data and the purebred experimental population (bottom line)