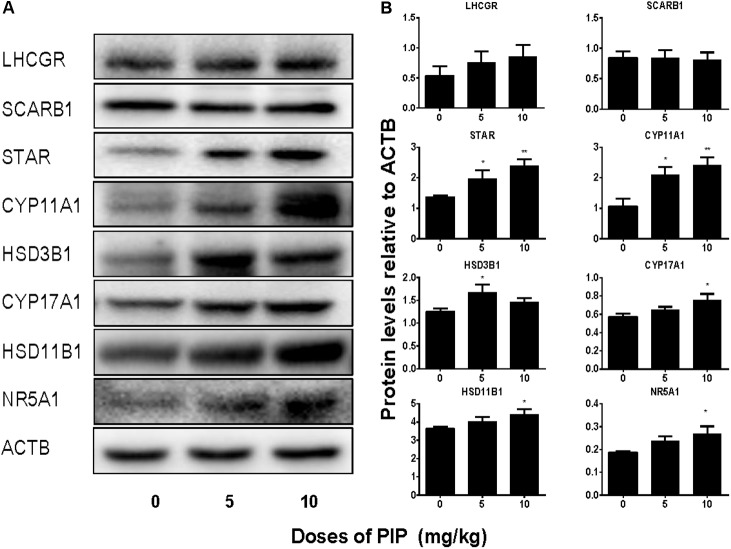
FIGURE 5.
Protein levels of the testes of rats with or without piperine (PIP) treatment. Protein expressions in the testis: (A) Western blot band. (B) Quantification of protein levels. Mean ± SEM, n = 6. ∗P < 0.05, ∗∗P < 0.01, indicate significant differences when compared to the control (0 mg/kg), respectively.

