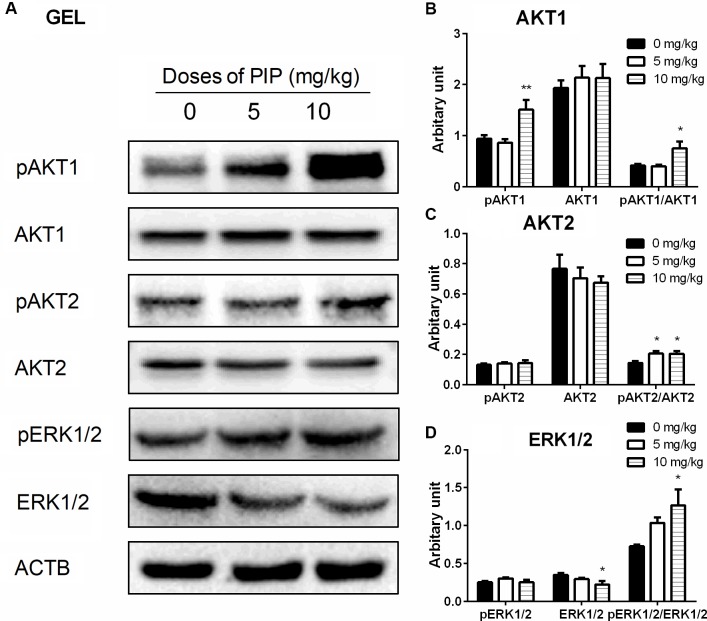
FIGURE 7.
The kinase and phosphorylated kinase protein levels of the testes of rats with or without piperine (PIP) treatment. (A) Western blot band. (B–D) Quantification of kinase and phosphorylated kinase protein levels. Mean ± SEM, n = 6. ∗P < 0.05, ∗∗P < 0.01 indicate significant differences when compared to the control (0 mg/kg), respectively.

