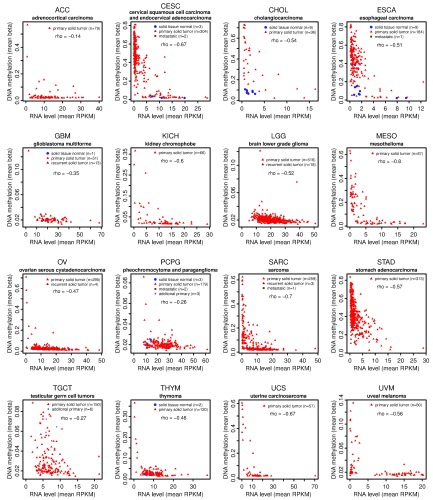
Figure 1. Integration of the MORT expression and the MORT promoter DNA methylation TCGA data for 16 tumor types.
The x-axis shows the MORT expression level according to RNA-seq and y-axis shows the level of MORT promoter DNA methylation according to Illumina HumanMethylation450 microarray. The correlation coefficient rho between the MORT expression and the DNA methylation of MORT promoter for each tumor type is displayed. The OV has a very low number (10) of samples analyzed by the HumanMethylation450 platform, therefore the data from the HumanMethylation27 platform that covers 2 CpGs out of 7 CpGs covered by HumanMethylation450 were used.

