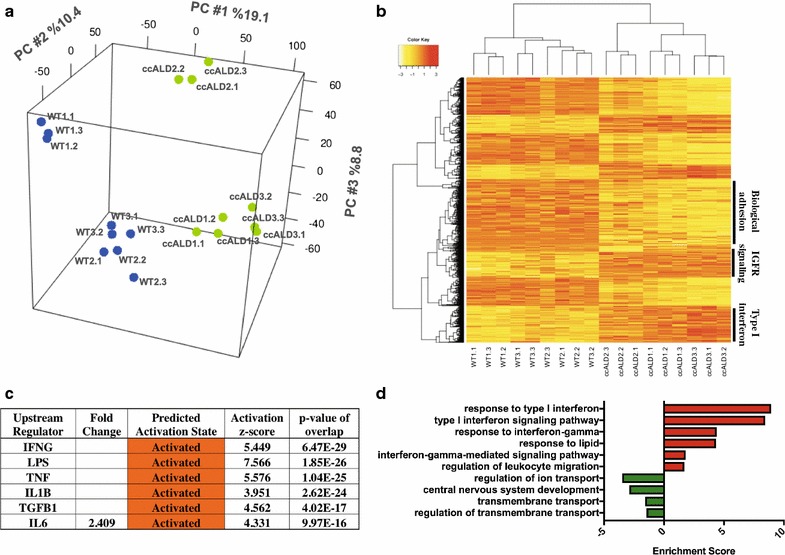
Fig. 4.

Transcriptome analysis indicates differences in Type I interferon activation and lipid metabolism pathways. a PCA mapping of log2 normalized read counts on global gene expression. The first three dimensions account for 38.3% of the total variance with grouping of individual WT- and ccALD-iBMEC replicates and separation of the experimental and control samples along PC1. b Heat map of DEG (n = 1381) on log2 normalized read counts. Cluster annotations are from gene ontology analysis. c IPA upstream regulator analysis of transcriptional regulators predicted by activation z-scores. p-values calculated by Fisher’s exact test using expected and observed genes overlapping with the WT versus ccALD DEGs and all genes regulated by each transcriptional regulator. d GO terms of pathways upregulated in ccALD in red with downregulated pathways in green. Data analyzed from three independent experiments with three biological replicates each (n = 9)
