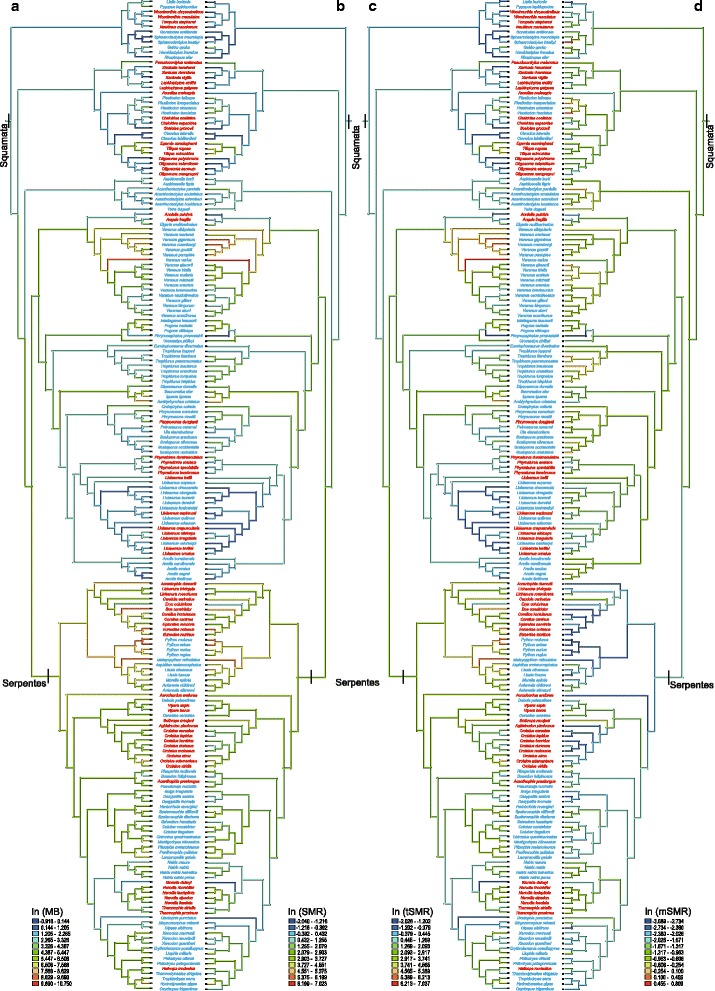
Fig. 1.

Mirror trees of the evolutionary history reconstructions of body mass (a), standard metabolic rate (b), temperature-corrected standard metabolic rate (c) and mass-corrected standard metabolic rate (d). Oviparous species are in blue, and viviparous species in red. Ancestral states are shown for visual purposes
