Fig. 4.

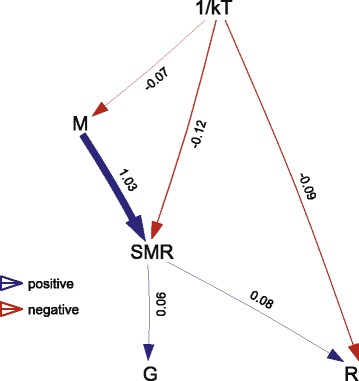
Visual representation of the averaged best-fitting path models (ΔCICc ≤2) for the squamate. Arrows indicate the direction of the path. See Fig. 3 for definitions for M, SMR, G, R and 1/kT

Visual representation of the averaged best-fitting path models (ΔCICc ≤2) for the squamate. Arrows indicate the direction of the path. See Fig. 3 for definitions for M, SMR, G, R and 1/kT