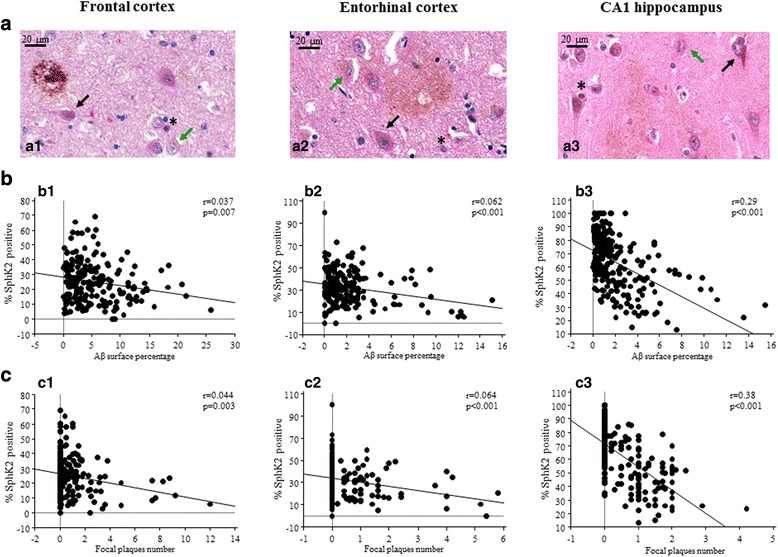
Fig. 2.

Immunohistochemical study of SphK2 protein expression and Aβ deposits. a Double labeling of SphK2 and Aβ in AD brain sections (n = 25) from frontal (a1) entorhinal cortex (a2) and CA1 hippocampus (a3). Images were taken at 40× magnification (Scale bars represent 20 μm). Black arrows show SphK2 positive neurons, green arrows show SphK2 negative neurons and asterisks show SphK2 positive oligodendrocytes. b Scatter plots depicting the relationship between density of amyloid deposits or Aβ surface percentage (x axis) and SphK2 expression (y axis) in frontal cortex (b1), entorhinal cortex (b2) and CA1 (b3). Regression lines are displayed. c Scatter plots depicting the relationship between number of focal plaques number (x axis) and SphK2 expression (y axis) in frontal cortex (c1), entorhinal cortex (c2) and CA1 (c3). Regression lines are displayed. The results are based on evaluation of 5305 neurons in the frontal cortex, 3238 neurons in entorhinal cortex and 3198 neurons in CA1
