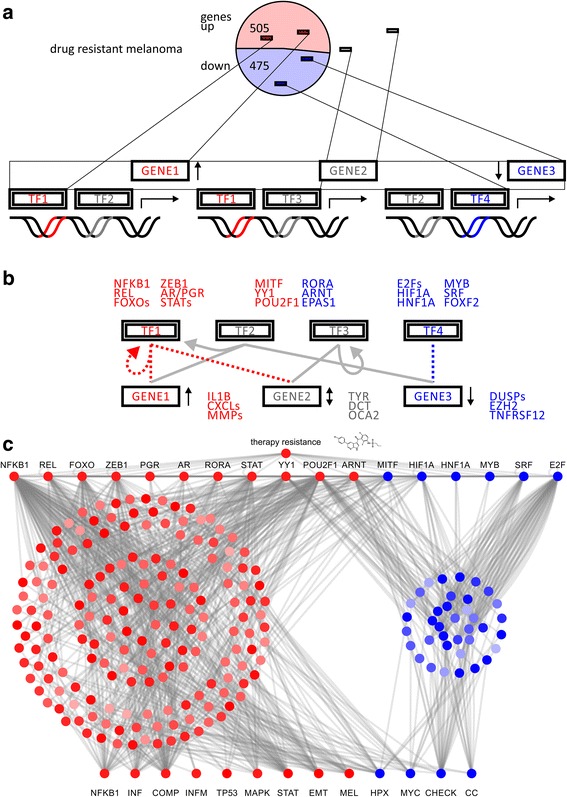
Fig. 3.

Transcription factor motif analysis of mitogen activated protein kinase inhibitor resistance in cellular models of malignant melanoma. a Schematic representation of differentially expressed genes in drug resistance model and transcription factor motifs associated with regulated target genes. Upregulated and downregulated factors are depicted in red and blue, respectively. b Hierarchical transcription factor network with master regulators on top and downstream targets at bottom. Sets of transcription factor target genes are identified in enrichment analysis based on sequence motifs. c Hierarchical network model illustrates how therapy resistance in cancer selects for specific transcriptional master regulators to rewire target genes in effector pathways in a concerted fashion
