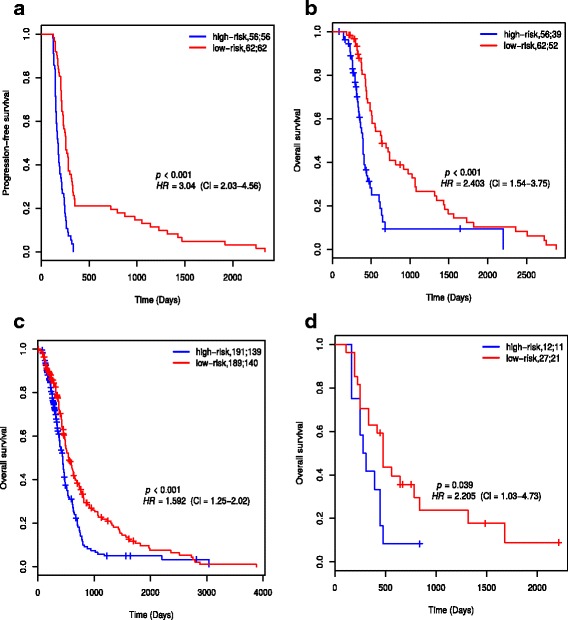
Fig. 3.

Kaplan-Meier plots for low-risk and high-risk groups of GBM patients that received adjuvant chemotherapy and radiotherapy. The patients were classified based on PI score. a PFS plots and b OS plots of risks groups from 118 TCGA patients not used in the feature selection. c OS plots of risk groups from 380 TCGA patients with OS times. d OS plots of risks groups from the Murat et al. data set used for validation. The two numbers in the topright corner of each plot represents the total number of patients in each risk group and the number of patients who experienced progression or death within the follow-up periods, respectively
