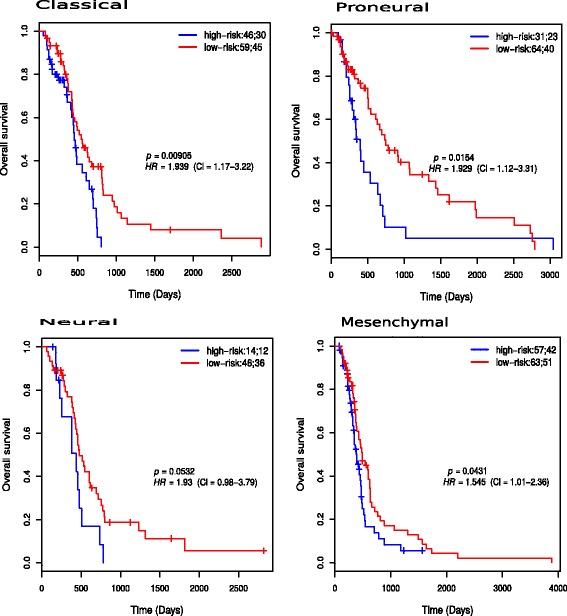
Fig. 5.

Kaplan-Meier overall survival plots for risk groups of patients in each subtype of GBM. The patients were classified based on PI score. The two numbers in the topright corner of each plot represents the total number of patients in each risk group and the number of patients who experienced progression or death within the follow-up periods, respectively
