
Fig. 2.
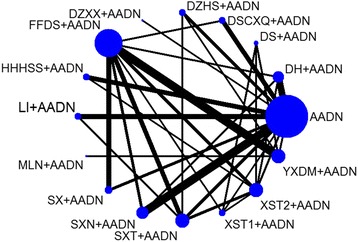
Network of the included comparisons. Note: Nodes are proportional to the number of patients included in the corresponding treatments, and edges are weighted according to the number of studies included in the respective comparisons
Official websites use .gov
A
.gov website belongs to an official
government organization in the United States.
Secure .gov websites use HTTPS
A lock (
) or https:// means you've safely
connected to the .gov website. Share sensitive
information only on official, secure websites.
Network of the included comparisons. Note: Nodes are proportional to the number of patients included in the corresponding treatments, and edges are weighted according to the number of studies included in the respective comparisons