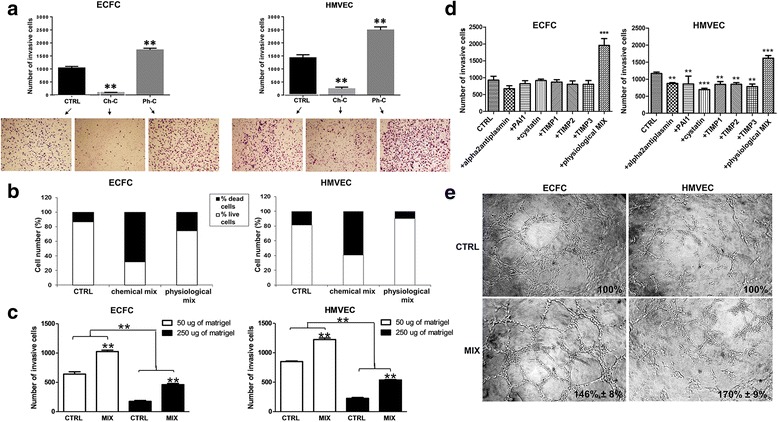
Fig. 1.

Induction of the amoeboid phenotype: Matrigel invasion and capillary morphogenesis. a Boyden chamber invasion assay through a thick Matrigel coating, in the presence of a chemical (Ch-C) or physiologic (Ph-C or MIX) protease inhibitor cocktail added to the Matrigel solution before polymerization. Histograms refer to quantification of Matrigel invasion assay obtained by counting the total number of migrated cells/filter. b ECFC and HMVEC cell viability upon protease inhibitor treatment after 6 and 24 (similar results not shown) hours evaluated by Trypan blue dye exclusion assay. The columns of histograms show in white the percentage of live cells and in black the percentage of dead cells. c ECFC and HMVEC invasion capacity in a Matrigel layer five times more concentrated (250 μg) than the usually used (50 μg). The ratio between the percentages of migrated cells in mesenchymal or amoeboid conditions after the increase of the Matrigel thickness doesn’t change. d Matrigel invasion assay in the presence of single inhibitors of the physiological MIX. Histograms refer to quantification of Matrigel invasion assay obtained by counting the total number of migrated cells/filter. e In vitro angiogenesis measured by capillary morphogenesis at 6 h in the presence and in the absence of the protease inhibitor MIX. Numbers on the lower right side of each picture indicate the percent field occupancy of capillary plexus as described in the Materials and Methods section. Quantification was performed at 6 h after seeding and was obtained by scanning of six to nine photographic fields for each condition. Results are the mean of 5 different experiments performed in duplicate, on two different clones derived from two different donors, on each cell line and are shown as mean value ± SD. *: p < 0.05; **: p < 0,001; ***p < 0,0001 significantly different from control
