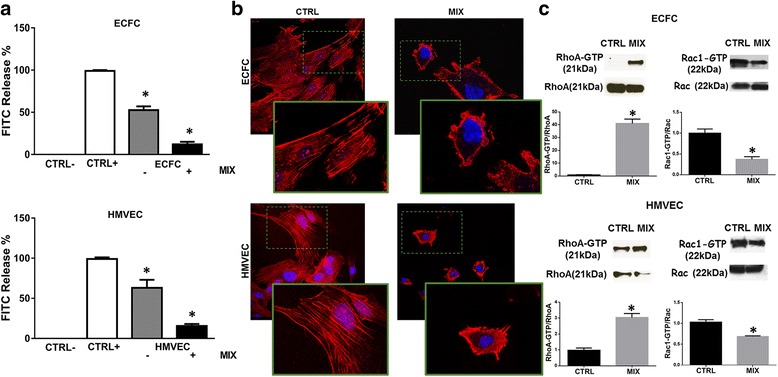
Fig. 2.

Induction of the amoeboid phenotype: cell morphology and Rac1/RhoA activation. a Histograms show the collagenolytic activity of ECFC and HMVEC cells under mesenchymal (-MIX) and amoeboid conditions (+MIX), expressed as % collagen degradation with respect to the positive control obtained by addition of exogenous collagenase. Ctrl-: collagenolytic activity in the absence of cells and exogenous collagen; Ctrl+: collagenolytic activity in the absence of cells but in the presence of exogenous collagenase; ECFC and HMVEC: collagenolytic activity in the presence of ECFCs or HMVECs. b Morphological features of the mesenchymal (elongated) to amoeboid (roundish) transition (MAT) of ECFCs and HMVECs. Each picture shows the general pattern and related magnification of a small field for each cell line. Red: phalloidin staining of the actin cytoskeleton. Blue: nuclear staining with DAPI. Magnification 40 X for reference pictures and 100 X for enlarged insets. Results shown are representative of two different preparations of each cell line under mesenchymal and amoeboid conditions. Sub-membranous cortical actin localization are evident chiefly in HMVECs and ECFCs. c Western blotting of total and GTP-loaded forms of small Rho-GTPasesRhoA and Rac1 under mesenchymal and amoeboid conditions for each cell line. RhoA-GTP and Rac1- GTP, GTP-loaded forms of small Rho GTP-ases; RhoA and Rac, total un-loaded forms of small Rho GTP-ases, used as a reference loading control. Numbers on the left refer to molecular weights expressed in kDa. Histograms report band densitometry. Results are the mean of 5 different experiments performed in duplicate, on two different clones derived from two different donors, on each cell line and are shown as mean value ± SD. *: p < 0.05 significantly different from control
