
Fig. 2.
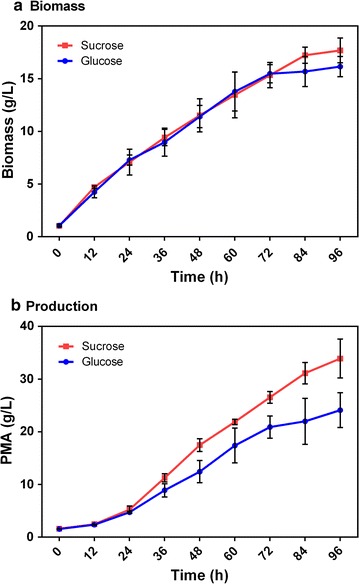
Batch fermentation of PMA production from glucose or sucrose in shake-flask culture. a Biomass and b PMA production. Glucose: line with blue circles; sucrose: line with red squares. The values shown represent the means of three independent experiments, and the error bars represent standard deviations of three values