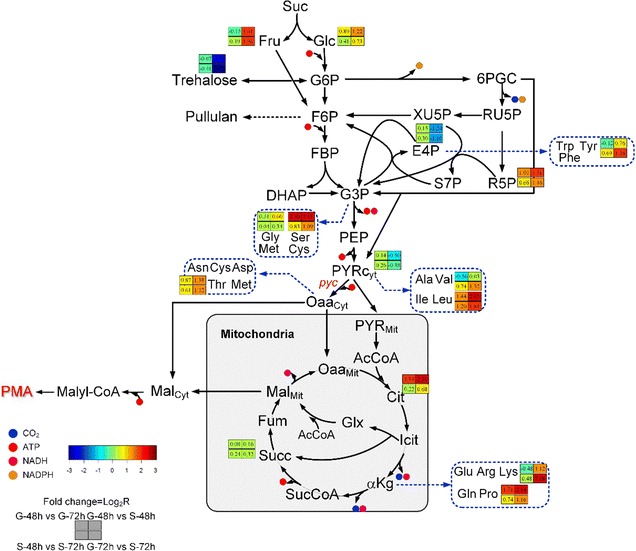
Fig. 3.

Key metabolite changes in PMA biosynthesis based on comparative metabolome analysis. Suc sucrose, Glc glucose, Fru fructose, G6P glucose 6-phosphate, F6P fructose-6-phosphate, FBP fructose 1,6-bisphosphate, DHAP dihydroxyacetone phosphate, G3P glyceraldehyde 3-phosphate, 6PGC gluconate 6-phosphate, RU5P ribulose 5-phosphate, XU5P xylulose 5-phosphate, R5P ribose 5-phosphate, E4P erythrose 4-phosphate, S7P sedoheptulose 7-phosphate, PEP phosphoenolpyruvate, PYR pyruvate, OAA oxaloacetic acid, AcCoA acetyl-CoA, Cit citrate, Icit isocitrate, αKg α-oxoglutarate, SucCoA succinyl-CoaA, Succ succinate, Fum fumarate, Mal malate, Glx glyoxylate, Trp tryptophan, Tyr tyrosine, Phe phenylalanine, Gly glycine, Ser serine, Met methionine, Cys cysteine, Asn asparagine, Asp aspartic acid, Thr threonine, Ala alanine, Val valine, Ile isoleucine, Leu leucine, Glu glutamic acid, Arg arginine, Lys lysine, Gln glutamine, Pro proline. The content of metabolites in A. pullulans CTCC2012223 cultured in glucose for 48 h was used as control and defined as 1.00; the contents of the other samples were used to calculate the fold change with the following formula: fold change = log2(R), R = B/A, A is the control, and B is the treated sample
