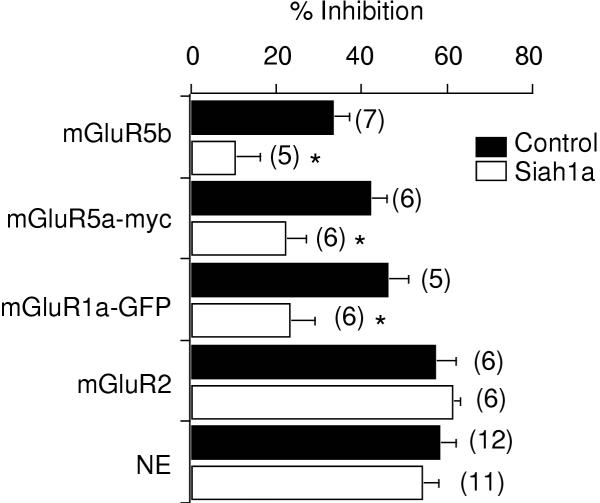
Figure 2.
Siah1a effect is specific for group I mGluRs. Bar graph illustrating average (+SEM) calcium current inhibition via the indicated receptor in the absence (filled bars) and presence (open bars) of Siah1a. The number of cells from each group is indicated in parentheses. * indicates a significant difference from control (p < 0.05, ANOVA).

