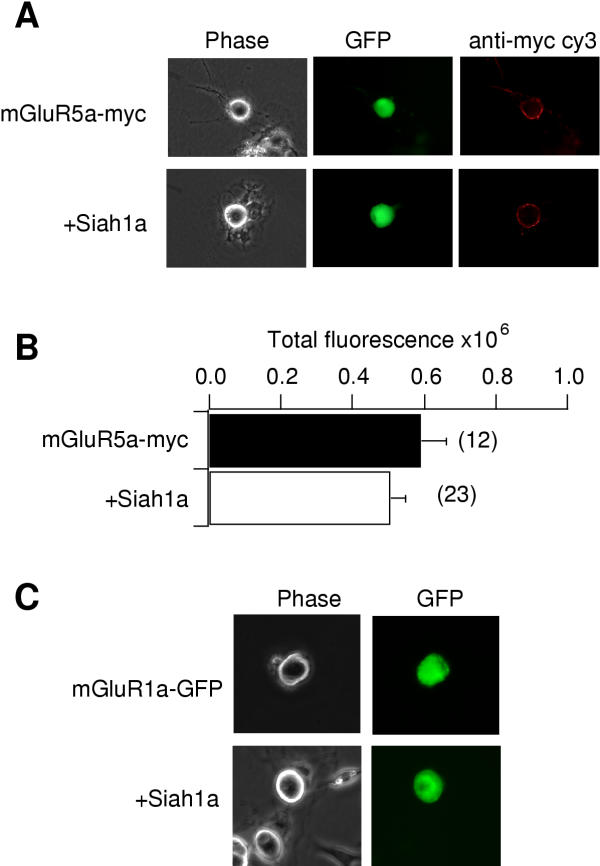
Figure 3.
Effect of Siah1a on mGluR surface expression and subcellular distribution. A, phase contrast image, GFP fluorescence, and surface cy3-conjugated anti-myc labeling of mGluR5a-myc from a cell expressing mGluR5a-myc alone (upper) and a cell coexpressing Siah1a (lower). Cy3-conjugated primary anti-myc antibody was applied to live cells before fixation to ensure labeling of only extracellular surface epitopes (see methods). B, Fluorescence measurments for cells expressing mGluR5a-myc (black bar) and mGluR5a-myc + Siah1a (open bar), as in A. The number of cells analyzed for each group is shown in parentheses. Units are arbitrary fluorescence units derived from 8 bit images (see methods). No significant difference was detected between the two groups (T-Test, p > 0.3). C, Phase contrast image and GFP fluorescence from a cell expressing mGluR1a-GFP alone (upper) and mGluR1a-GFP with Siah1a (lower).

