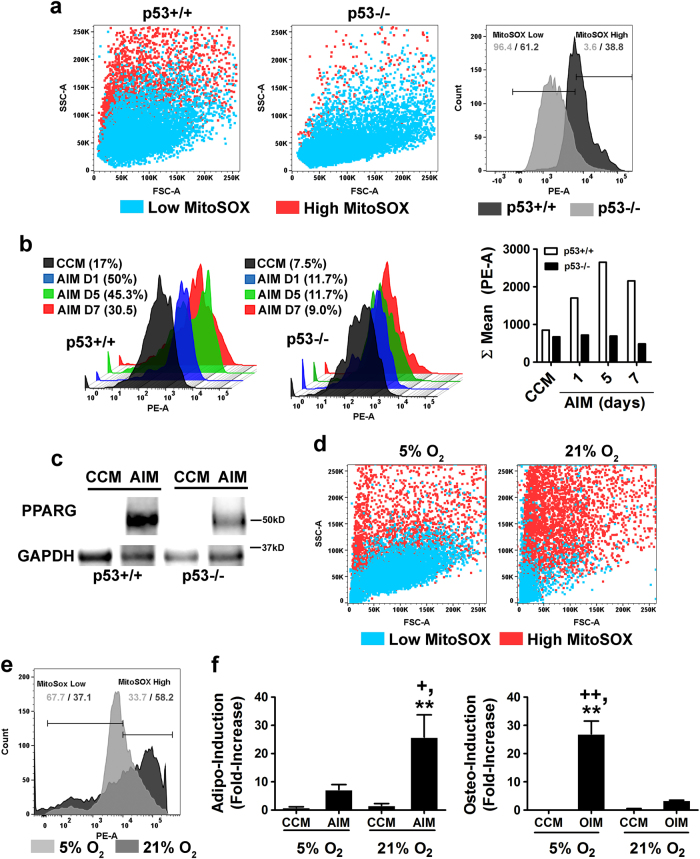
Fig. 2.
Basal p53 expression regulates the cellular redox balance in MSCs. a Dot plots (left) and histogram (right) of flow cytometric analysis of MitoSOXTM Red-stained p53+/+ vs. p53−/− MSCs. Horizontal lines in the histogram illustrate gating strategy for MitoSOXTM low and high populations. b Representative histograms depicting changes in mitochondrial ROS generation in p53+/+ vs. p53−/− MSCs over a 7-day time course of AIM exposure based on flow cytometric analysis of MitoSOXTM Red-stained cells. Bar graph (right panel) illustrates mean fluorescence intensity in the PE channel from each experimental sample. c Immunoblots of whole-cell extracts from MSC populations in (b) probed with anti-PPARG and anti-GAPDH antibodies. d Dot plots from flow cytometric analysis of MitoSOXTM Red-stained MSCs cultured in 5 or 21% oxygen saturation. e Histogram of flow cytometric data in (d). Horizontal lines illustrate gating strategy for MitoSOXTM low and high populations. f Effect of oxygen saturation levels (5% vs. 21%) on stimulus-driven adipogenic (left panel) and osteogenic (right panel) differentiation of MSCs. Data are mean ± S.D. (n = 4). **p < 0.01 vs. CCM, +p < 0.5 vs AIM, and ++p < 0.01 vs. OIM by one-way ANOVA and Tukey post hoc test

