Fig. 4.
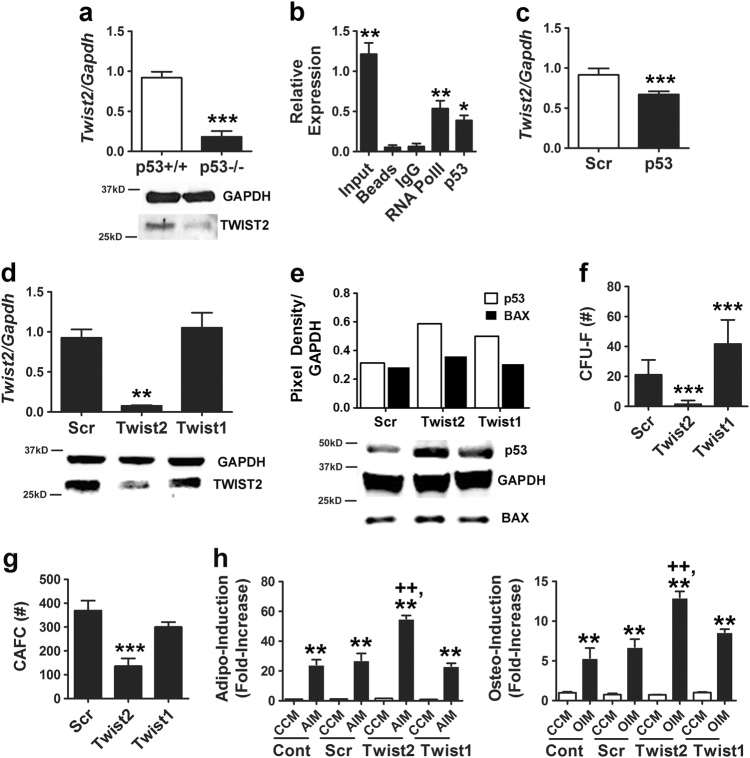
TWIST2 expression is downregulated in MSCs following p53 inactivation. a qPCR (top panel) and immunoblot (bottom panel) analyses of TWIST2 mRNA and protein levels, respectively, in p53−/− vs, p53+/+ MSCs. qPCR data are mean ± S.D. of experiments (N = 2) repeated twice. ***p < 0.005 by Student’s t-test. b ChIP showing pull-down of Twist2 promoter sequences using a RNA Pol II (positive control) or p53 antibody from cell extracts of MSCs treated with Nutlin-3a (20 µM). *p < 0.05, **p < 0.01 compared to IgG control by ANOVA and Tukey post hoc test. c Effect of siRNAs on Twist2 mRNA levels as determined by qPCR. Data are mean ± S.D. of experiments (N = 2) repeated three times. ***p < 0.005 by Student’s t-test. d qPCR (top panel) and immunoblot (bottom panel) analyses showing effect of siRNAs on TWIST2 mRNA and protein expression, respectively, in MSCs. qPCR data are mean ± S.D. of experiments (N = 2) repeated twice. **p < 0.01 compared to Scr by Student’s t-test. e Densitometry (top panel) and immunoblot (lower panel) showing effect of siRNAs on BAX and p53 protein expression in MSCs. f, g Effect of siRNAs on CFU-F (f) and CAFC activity (g) in MSCs. Data are mean ± S.D. of experiments (N = 6) repeated twice for CAFC and three times for CFU-F. ***p < 0.005 compared to Scr by Student’s t-test. h Effect of siRNAs on stimulus-driven adipogenic (left panel) and osteogenic (right panel) differentiation. Data are mean ± S.D. of experiments (N = 4). **p < 0.01 compared to CCM, ++p < 0.01 compared to Scr + AIM or Scr + OIM by ANOVA and Tukey post hoc test

