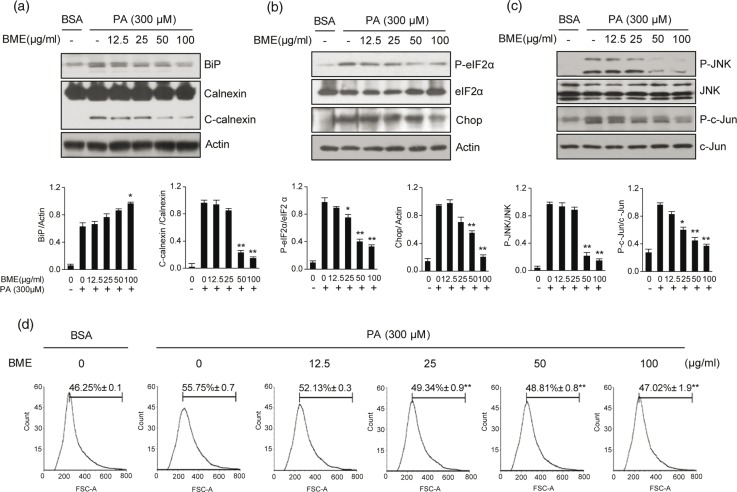
Fig. 2.
Reduction of ER stress–related markers in BME-treated HepG2 cells. HepG2 cells were treated with different concentrations of BME and 300 μM PA for 12 h. DMSO was used as a vehicle. ER stress was analyzed by measuring levels of BiP, calnexin (a), P-eIF2α, CHOP (b), P-JNK and P-c-Jun (c). Data are expressed as mean ± SD of three independent experiments. *p < 0.05, **p < 0.01 versus PA-treated group. (d) After treatment with BME and PA, cells were stained with DCFDA for 10 min. After washing twice with PBS, fluorescence intensity of DCFDA was determined by flow cytometry. Gated percentages are shown graphically. **p < 0.01 versus PA-treated group.

