
Figure 1.
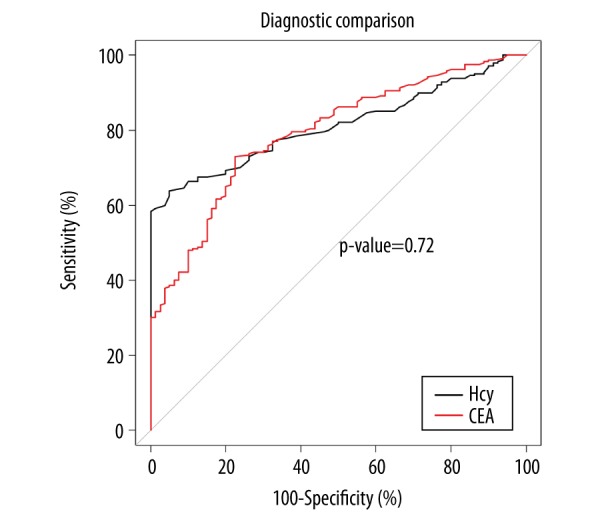
Receiver operating characteristic (ROC) curve of plasma levels of homocysteine and carcinoembryonic antigen (CEA) between the healthy controls and the groups of patients with rectal tumors (rectal adenoma and rectal cancer). There were no statistically significant differences in the area under the curve (AUC) between plasma homocysteine and carcinoembryonic antigen (CEA) (p=0.72). Additional parameters, including the optimal critical value, the 95% confidence interval (CI), specificity, and sensitivity, are presented in Table 4.