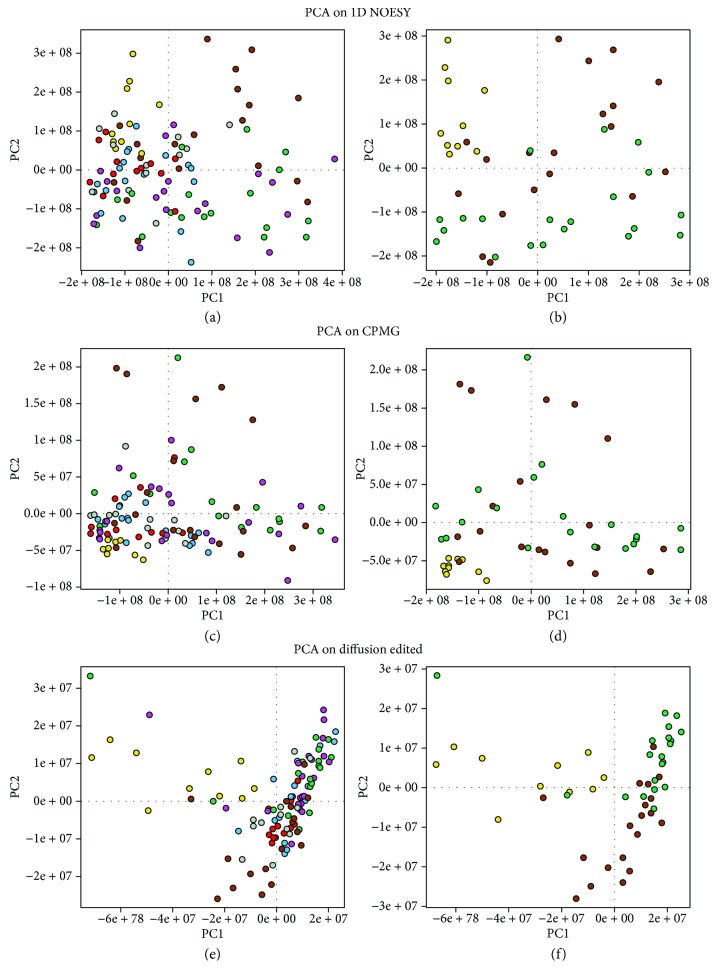
Figure 1.
Principal component analysis (PCA) score plots. Each dot represents a single NMR spectrum of plasma samples collected at different time points: healthy animals (Ha, yellow dots), 0 hour (brown dots), 3rd hour (green dots), 6th hour (magenta dots), 24th hour (light-blue dots), 48th hour (gray dots), and 72nd hour (red dots). (a) PCA on all 1D NOESY spectra; (b) PCA on Ha, 0 h, and 3rd-hour 1D NOESY spectra; (c) PCA on all CPMG spectra; (d) PCA on Ha, 0 h, and 3rd-hour CPMG spectra; (e) PCA on all diffusion-edited spectra; (f) PCA on Ha, 0 h, and 3rd-hour diffusion-edited spectra.

