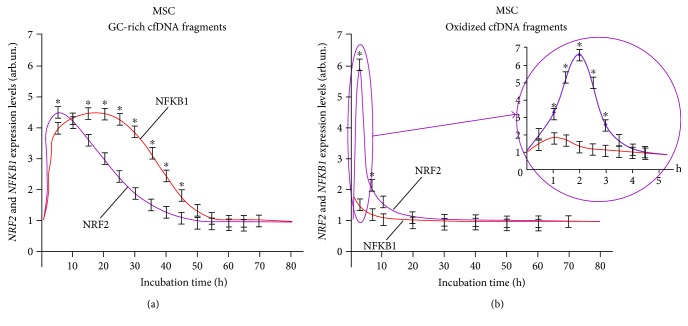
Figure 2.
NFKB1 and NRF2 expression curves under the action of (a) GC-rich and (b) oxidized fragments in mesenchymal stem cells (MSC). The expression levels were determined every 5 minutes after adding the corresponding fragments (model GC-rich fragments, model oxidized fragments) using real-time PCR. For each gene, the expression level was calculated relating to the internal standard gene ТВР, with a spread in values at every point not exceeding 5%. ∗Significant difference (p < 0.05) between the relative values of NRF2 and NFKB1.

