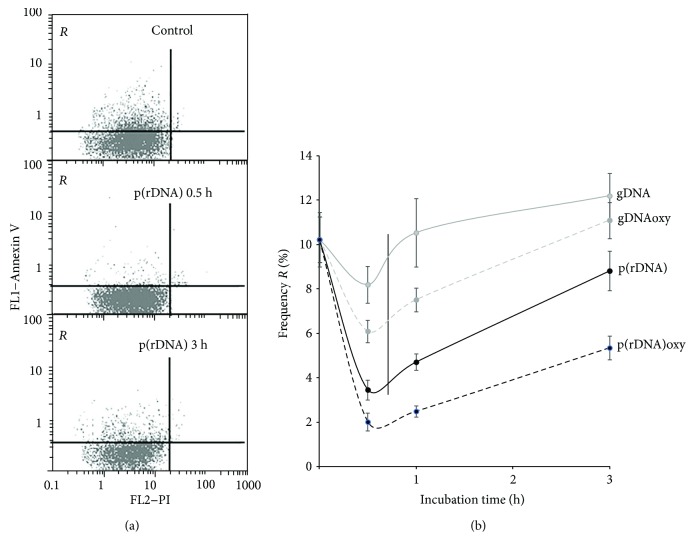
Figure 5.
Time profiles of the fraction of apoptotic cells in HUVEC. (a) Annexin V fluorescence is plotted along the y-axis, and PI fluorescence is along the x-axis. From top to bottom: controls, after 1 hour and after 3 hours of exposure to p(rDNA) in a concentration of 50 ng/ml. (b) Temporal course of the frequency of apoptotic cells (cells belonging to the framed R fraction, i.e., with low PI and high annexin V fluorescence) in HUVEC culture according to the detection of cell surface levels of annexin V, a marker of early apoptosis during the cultivation with cfDNA fragments. Every curve significantly differs from the control (p < 0.05). gDNA: genomic DNA; p(rDNA): ribosomal repeat on a plasmid; gDNAoxy: oxidized genomic DNA; p(rDNA)oxy: oxidized ribosomal repeat.

