
Figure 4.
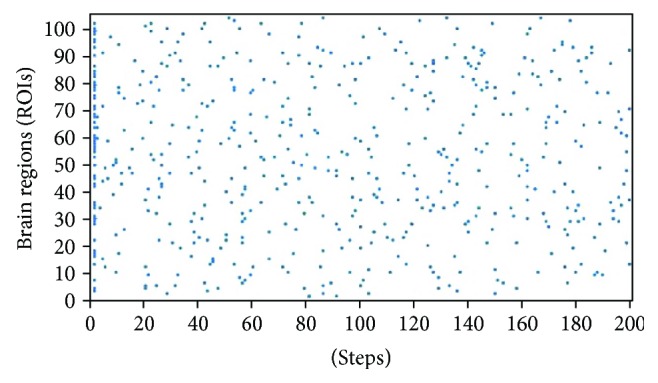
Example of a simulated time series. The time series corresponds to the condition included in Figure 5(b) (blue curve), namely, to the following parameter values: sop = 0.225, nep = 0.025, πp = πn = 0.1, and absolute-values-proportional-threshold = 100%. The spots indicate an excited state (E) for each of the 105 brain regions in each step of the simulation.