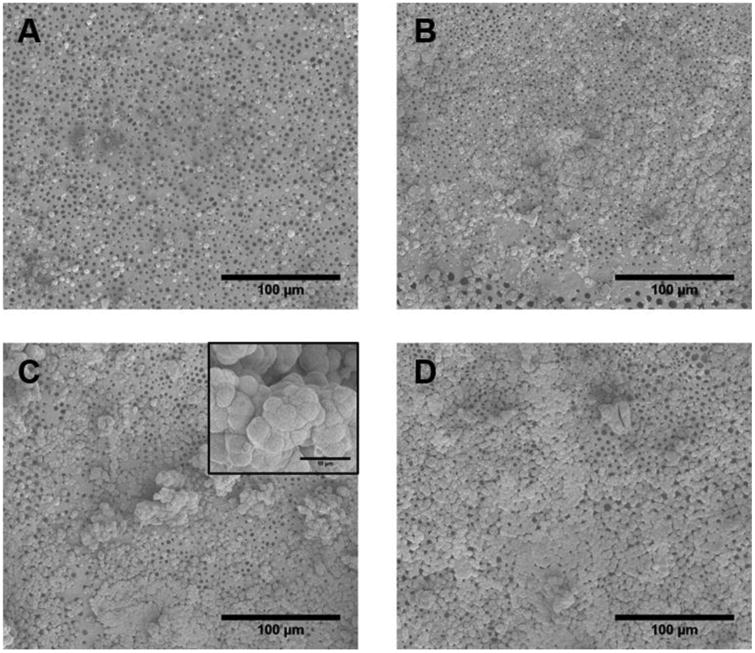
Figure 5.

In vitro biomineralization of the PLGA-Mg composites. The samples were immersed in 1.5 × for 14 days. Representative SEM micrographs show the deposited biomineral for (A) PLGA, and (B-D) for composites with Mg content of 1, 3, and 5 wt%, respectively. Insert in C shows representative close-up of apatite nucleates (Scale bar 10 μM). PLGA sample showed small isolated nucleation of calcium apatite. The amount of apatite nucleation increased with Mg concentration in composites, with 5 wt% samples displaying the greatest amount of apatite nucleates with greater amount of surface coverage.
