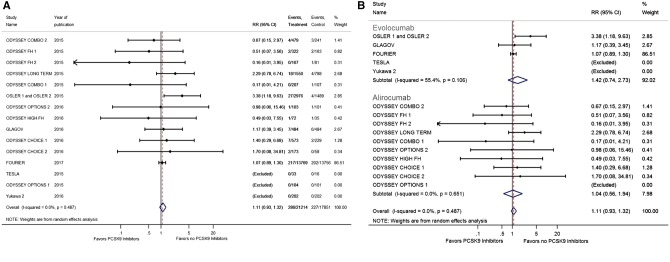
Figure 4.
(A) Forest plot comparing the incidence of neurocognitive deficits between PCSK9 inhibitor and the no PCSK9 inhibitor groups. (B) Forest plot comparing the incidence of neurocognitive deficits between PCSK9 inhibitor and the no PCSK9 inhibitor groups in subgroups. The blue diamond is the point estimate representing the 95% confidence interval. The red dotted lines represent the random effects generated overall estimate. Data are presented with risk ratios and 95% confidence intervals. RR: risk ratio, PCSK9: proprotein convertase subtilisin/kexin type 9.

