
Extended Data Fig. 10. Additional data on clonal origin of Mk progenitors.
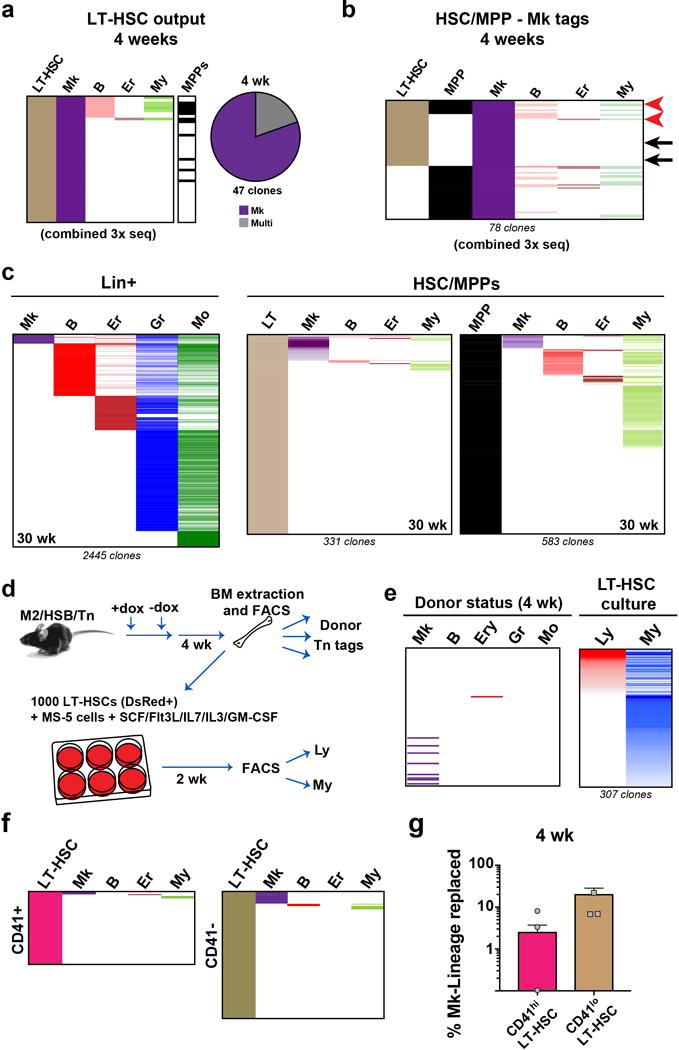
a, Three independent Tn tag libraries were prepared and sequenced for LT-HSC, MPP, and the five Lin+ populations, from one mouse at 4 weeks. Each column represents the combined tags detected from 3 amplicon libraries prepared for each population, to facilitate visualization of the smallest clones. Tags are coloured by frequency in each lineage, and organized by rank. b, Origin of Mk. Alignment of all Mk clones which had detectable tags in HSC/MPPs from a mixed library combining 3 independent sequencing reactions. Tags are coloured by frequency in each lineage (except for Mk), and organized by rank. Arrows indicate tags verified by clone-specific PCR. c, Alignment of Tn tags from all Lin+ populations, LT-HSCs and MPPs collected from 30 wk chased-mice. Tags are coloured by frequency in each lineage, and organized by rank. d, Experimental design for testing in vitro myeloid and lymphoid potential from sorted LT-HSCs. e, In vitro myeloid potential of LT-HSCs. Alignment of donor Lin+ tags with Tn tags obtained from myeloid and lymphoid cells derived from donor LT-HSCs after 2 weeks in culture. f, Clonal output of CD41hi and CD41lo LT-HSCs at 4 weeks post labeling. g, Quantification of Mk lineage replacement by CD41hi vs. CD41lo LT-HSCs (measured as % of overlapping/total Mk reads) at 4 weeks post labeling. Values are mean +/− s.e.m. of 3 independent mice.