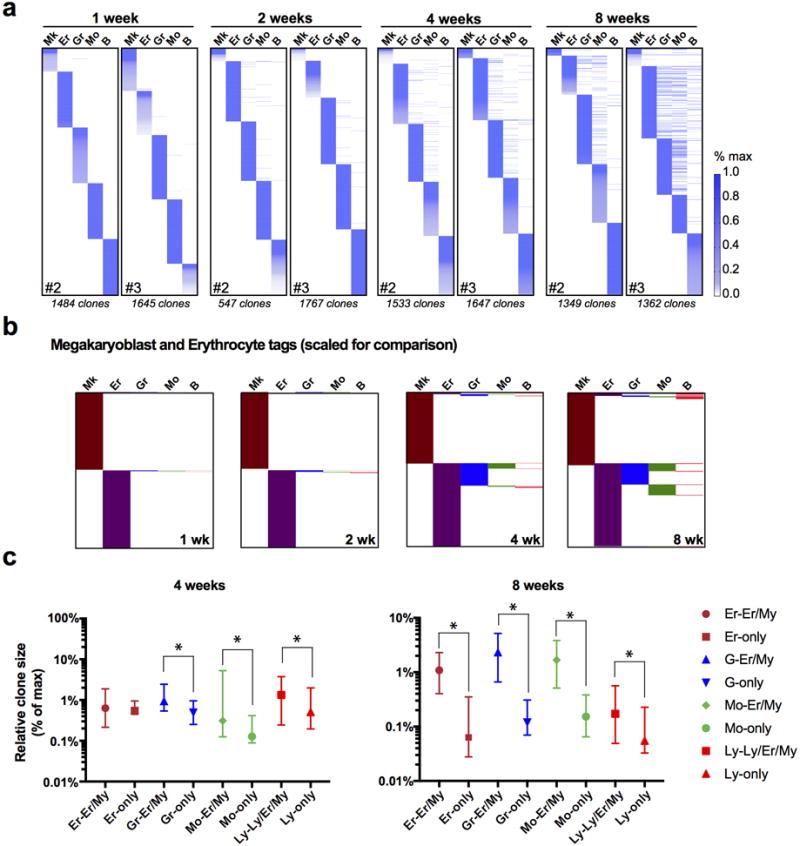
Extended Data Fig. 4. Additional representations and analyses of Lin+ tags.

a, Lin+ clones of the second and third mice used for quantifications in Fig. 1d–g. b, Scale-adjusted binary (presence/absence) representation of all detected Mk and Er tags in the experiments from Fig. 1d–g. c, Relative quantification of scale-normalized clone sizes for each lineage, comparing unilineage vs. oligo/multilineage clones. Values are interquartile range and median from 3 independent mice at 4 week and 8 week post-induction.
